


The IT budget answers how much the company intends to spend and how much it spent. On its own, it does not answer what that spending changed in the business. An integration can protect revenue by reducing delays. An automation can free capacity without reducing cash. A security investment can reduce exposure without creating new revenue. Better data can speed up decisions without producing a linear financial effect.
Measuring the value of technology therefore takes a different question. Which capability changed, what changed in the operation, which signal proves that change, and where did the effect show up in the business?
The thesis of this article is simple. Technology becomes financially manageable when its contribution chain is visible enough to guide a capital decision. That does not mean attributing every result to technology. It means gathering evidence sufficient to decide whether an investment should be scaled, corrected, sequenced, kept or stopped.
The budget measures the expense. The value shows up elsewhere
The budget remains essential. It shows capital commitment, recurring cost, spending variation and financial pressure. The problem starts when a company uses that view as if it also measured value.
The economic effect of technology usually appears outside the IT line. It can surface in revenue, margin, operational capacity, risk, continuity or decision speed. Technology Business Management, for example, connects financial and operational technology data to the results the company wants to produce.
That changes the executive conversation. The question stops being only how much IT costs and starts including what that cost made possible, with which evidence, and with which economic effect.
Cost, contribution and realized benefit are not the same thing
Three concepts help avoid confusion.
Technology cost is the resource consumed to maintain or create a capability. It includes people, software, infrastructure, services and other necessary spending.
Economic contribution is the business change the capability helps produce. It can be less waiting, less rework, higher availability, lower exposure, better conversion or a faster decision.
Realized benefit is the part of that contribution that was observed and measured against a baseline, within a defined period and with someone accountable for the result.
That separation matters because not every kind of value turns into cash the same way. Freed capacity is not automatic financial savings. Reduced risk is not revenue. A strategic option can hold value even when there is no realized return yet. Forcing everything into a single formula creates apparent precision and can make the decision worse.
Four lenses help locate the economic effect
For this analysis WatchZ uses four lenses. They are a consultative model for organizing the investigation, not a universal taxonomy.
1. Revenue and growth
Technology can contribute when it allows the company to serve more demand, launch earlier, reduce abandonment, increase channel availability or sustain new revenue models. The evidence has to link the capability to the commercial change. Buying a platform, on its own, proves no growth.
2. Margin and operational capacity
Automation, integration, architecture and simplification can reduce rework, manual effort, cost per transaction or cycle time. There is an important difference between freeing hours and reducing cash. If the freed capacity is absorbed by more demand, the gain exists, but it shows up as capacity rather than as accounted savings.
3. Risk and resilience
Security, continuity and reliability can reduce exposure to incidents, downtime and operational failures. NIST recommends treating information and communications technology risk as part of enterprise risk, tied to the mission and to business objectives. The economic translation of that risk depends on the company context and should be presented as an estimate, a scenario or an exposure, never as certain savings.
4. Speed and quality of decisions
More reliable data, less manual reconciliation and better observability can shorten the time to decide and improve the quality of the information managers use. The economic effect appears when that improvement changes a relevant decision, avoids a loss, brings an opportunity forward or improves capital allocation.
The four lenses do not compete with each other. A single investment can produce more than one type of effect. What matters is avoiding double counting and being clear about where each benefit appears.
The contribution chain links capability to decision
A recurring error in business cases is jumping from the technical delivery to the financial result. Between the two there are operational changes, adoption, dependencies and external factors. Ignoring those links makes weak attribution easy.
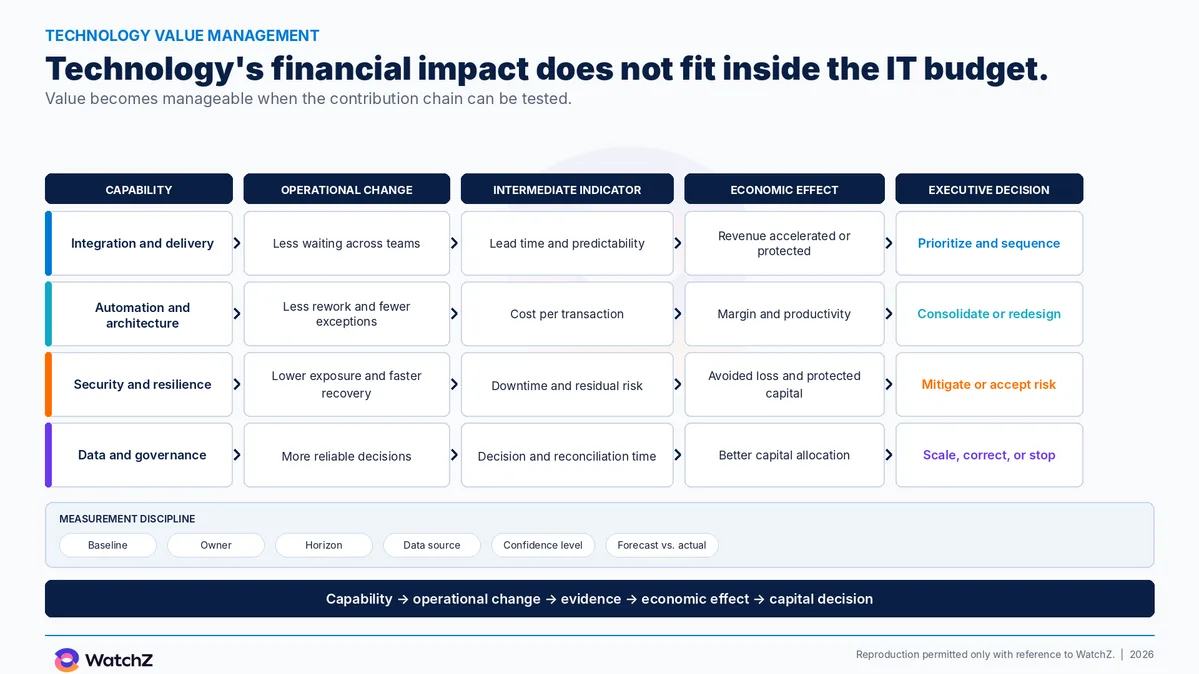
A simple contribution chain can be tested in six steps.
- Technological capability. What became possible, or more reliable?
- Operational change. What do teams, processes or customers now do differently?
- Intermediate indicator. Which signal shows the change actually happened?
- Business result. Which operational or commercial result was affected?
- Economic effect. Did that result affect revenue, cost, capacity, risk or capital?
- Capital decision. Does the evidence justify scaling, correcting, sequencing, keeping or stopping?
Consider an integration between systems that reduces waiting and failures across areas. The technical capability is the more reliable integration. The operational change is less manual work and shorter queues. The indicator can be cycle time and error rate. The business result can be a more predictable launch. The economic effect can be protected revenue, avoided rework cost or an opportunity brought forward. The capital decision depends on the strength of that evidence, and the full version of this example lives in the article on the economic impact of enterprise systems integration.
This reasoning is compatible with two useful references. DORA research relates capabilities to delivery performance and to organizational outcomes, without treating an isolated technical metric as proof of result. The contribution analysis in the Magenta Book starts from a similar question. Which evidence supports the claim that an intervention contributed to an observed result, given other possible explanations?
The goal, then, is not to prove perfect causality in every business decision. It is to make the contribution testable and to state where uncertainty remains.
Measure the benefit without fabricating precision
For material investments, WatchZ recommends recording eight elements before treating a benefit as a basis for decision. This is a management discipline, not a universal rule.
- Baseline. What was the situation before the change?
- Target and horizon. What should change, and by when?
- Benefit owner. Who answers for the result beyond the technical delivery?
- Method and source. How will the change be measured, and where will the data come from?
- Dependencies. What has to happen beyond the technology?
- External factors. What can alter the result without a direct relation to the initiative?
- Confidence level. How strong is the available evidence right now?
- Forecast against actual. What was hypothesis and what actually happened?
Benefits realization references, such as those from PMI and from the UK Government Project Delivery function, reinforce the need to identify, track and sustain benefits across the investment cycle, rather than closing the analysis at project approval.
It also helps to separate four types of value in the executive presentation.
Cash. Additional revenue, or cost that genuinely stops existing.
Capacity. People, time or infrastructure freed to absorb more demand or do higher value work.
Risk. Reduction in exposure, probability, impact or recovery time.
Option. Capability that opens future choices, such as entering a channel, meeting a rule or testing a new business model.
Each type calls for different evidence. Mixing them into a single line of savings weakens the analysis.
If the decision is specifically how to build and test ROI before the investment, the deeper treatment belongs in how to measure technology ROI before investing. This page has another role. It shows where the economic effect appears and how to build the bridge between capability and decision.
Governance turns evidence into decision
Measuring is not enough. The company has to decide what it does with the evidence.
Useful governance defines who can approve, correct, pause or expand an investment. It also defines when the benefit will be reviewed, which risk limits are acceptable and which signals require a new decision. COBIT organizes governance and management of information and technology around enterprise objectives and value creation, and the concrete design has to be proportional to the context.
There is a trade-off. Insufficient control leaves investments without an owner and without review. Excessive control adds steps, reduces speed and can destroy part of the value it meant to protect. Governance should raise the quality of the decision without turning every decision into a heavy ritual.
The design of decision rights, forums and guardrails deserves its own treatment. That depth lives in IT governance decides the return on technology.
Not every investment should compete on the same yardstick
An investment to keep a critical operation running should not be evaluated exactly like a growth initiative. The same holds for an optional capability that prepares the company for a future change.
In practice it helps to separate four economic functions.
- Operate and protect. Sustain continuity, security and mandatory requirements.
- Optimize. Reduce waste, unit cost, rework or cycle time.
- Grow. Expand revenue, conversion, reach or launch speed.
- Create option. Open a capability that allows future choices with potential value.
This classification does not replace portfolio prioritization. It stops every initiative from being forced to prove value through the same metric. The comparison between investments, constraints and sequence belongs in the specific portfolio prioritization content.
An executive cycle makes the value observable
The work gets simpler when the company repeats the same decision cycle.
1. Diagnose the constraint. Identify the business problem before choosing the technical solution.
2. State the contribution hypothesis. Declare which capability should change, which operational effect is expected and where the value can appear.
3. Instrument the evidence. Define baseline, intermediate signals, result, data source, horizon and owner.
4. Allocate and sequence capital. Compare the initiative against other needs and make the opportunity cost explicit.
5. Review benefit and risk. Compare hypothesis against actual. Revisit dependencies, external factors and confidence level.
6. Take a new decision. Scale, correct, defer, keep or stop, based on the available evidence.
The cycle matters more than a perfect business case at the start, and the execution sequence behind it lives in the technology evolution roadmap. Decision quality rises when the company learns from what happened and updates the investment over time.
What weakens the analysis
Some errors make financial impact less visible, even when the initiative does produce value.
Without a baseline, any improvement looks attributable to the project. The comparison is weak because there is no earlier reference.
Without a benefit owner, the technical delivery becomes a substitute for the result. The team can finish the project without anyone answering for the business change.
An isolated technical metric does not close the chain. Fewer incidents, more deployments or lower latency can be important signals, and they still need to connect to the result the company wants to protect or improve.
Double counting inflates the case. The same freed capacity cannot appear at once as cash savings and as capacity to serve more demand without explaining the relation between the two uses.
Total attribution ignores other causes. Market, price, process, adoption, people and commercial decisions also influence the result. The analysis has to show those dependencies.
A universal ROI creates false comparability. Direct financial return, risk, capacity and option are not equivalent. A company can compare them, and it has to keep the type of value and the uncertainty of each one visible.
The decision improves when the chain becomes visible
Technology should not be judged by the cost line alone. It should also not receive automatic credit for every result that happens after a rollout.
The discipline sits in between. The company has to link technological capability, operational change, intermediate evidence, business result, economic effect and capital decision. It has to separate forecast from actual and show the owner, the dependencies and the confidence level.
When that chain becomes visible, the debate stops depending on perception. The budget keeps showing how much was spent. Value management starts showing why it is worth keeping, changing or stopping the investment.
Sources
- TBM Council. "The TBM Framework: Connecting Technology to Business Value". https://www.tbmcouncil.org/framework/
- DORA. "Research". https://dora.dev/research/
- NIST. "Enterprise Impact of Information and Communications Technology Risk", SP 800-221 (November 2023). https://csrc.nist.gov/pubs/sp/800/221/final
- HM Treasury. "Magenta Book Annex A: Analytical methods for use within an evaluation". https://www.gov.uk/government/publications/the-magenta-book/magenta-book-annex-a-analytical-methods-for-use-within-an-evaluation-html
- Government Project Delivery. "Practitioner workbook for benefits management in government" (July 29, 2026). https://projectdelivery.gov.uk/library-product/practitioner-workbook-for-benefits-management-in-government/
- Project Management Institute. "Benefits Realization Management Framework" (November 2016). https://www.pmi.org/learning/thought-leadership/series/benefits-realization/benefits-realization-management-framework
- ISACA. "COBIT". https://www.isaca.org/resources/cobit
Note: the four lenses, the eight elements of the benefit record and the four economic functions are WatchZ advisory propositions, with no correspondence to a regulatory standard or a third-party framework. NIST is credited only with integrating technology risk into enterprise risk, not with the economic translation of that risk.