


Technology immaturity rarely shows up as an accounting line. It shows up as product delay, rework, incident, manual effort, contested data, dependence on a few people and investment that never scales. That is why it stays out of the executive conversation for so long.
The problem is economic before it is technical. When technology capability fails to keep up with business ambition, the company creates a gap between what it promises the market and what it delivers with predictability. That gap becomes a recurring cost.
Every company pays this bill somehow. Some pay with margin. Others with deadlines. Others with operational risk, lost customers, low productivity, slow decisions or poorly allocated capital. The most dangerous part is that this bill tends to look normal.
The first move is to name the cost, before buying any new tool or opening another transformation program.
The invisible cost is born when the company measures spend but not exposure
A company usually knows how much it spends on technology. It rarely knows how much it loses to technology immaturity.
That difference changes the conversation. Spend is what shows up in the budget. Exposure is what the company loses when technology slows velocity, raises risk or blocks value capture. Technology maturity has to be discussed in that second field.
A CFO needs to understand which costs will fall, which risks will be controlled, which revenue will be unlocked and which decisions gain predictability, not hear that the company should modernize. Without that translation, maturity becomes a technical topic. With it, maturity becomes capital allocation. A capability assessment turns that exposure into a number before the decision to invest.
Five fronts make the cost of immaturity measurable
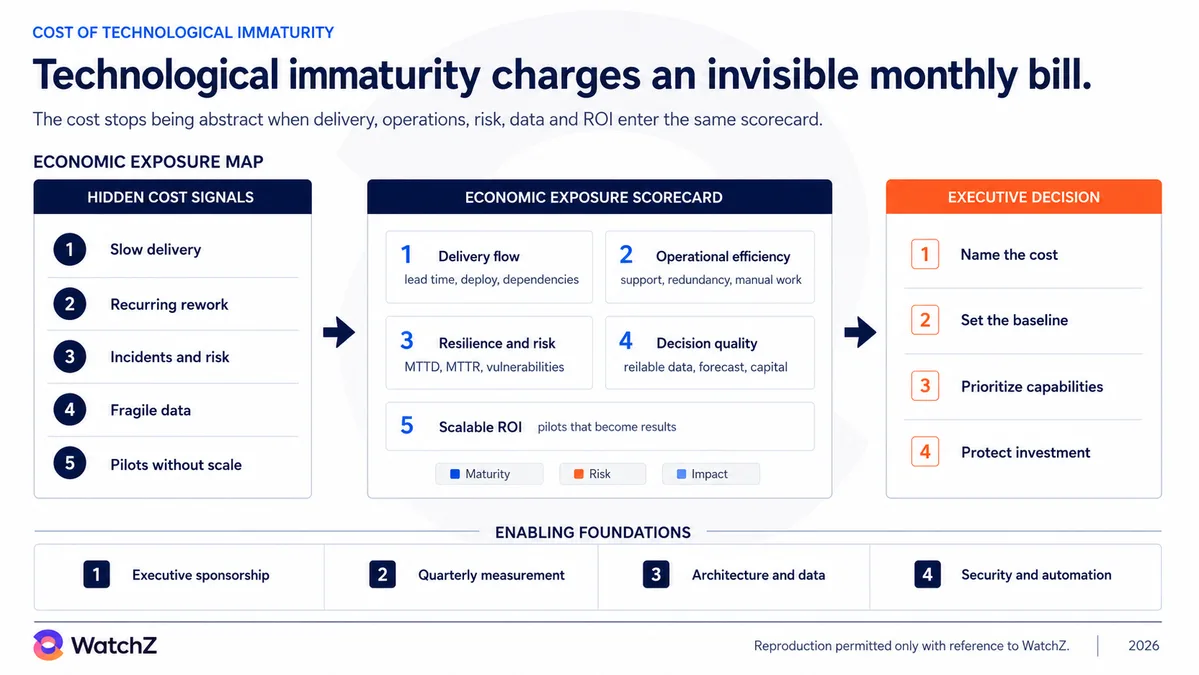
The cost of technology immaturity can be organized into five fronts. They do not solve everything, but they create an executive map good enough to leave abstraction behind.
Delivery flow
Lead time, deployment frequency, rework, dependency between teams and blocked changes show whether strategy can turn into product, service or operational improvement. When that flow is weak, the loss shows up as delayed revenue, missed opportunity, idle teams and a backlog that grows faster than execution capacity. The company becomes slower than its own strategy requires.
Operational efficiency
Maintenance cost, corrective work, manual processes, redundant platforms, fragile integrations and duplicate licenses consume technical capacity. This cost tends to be accepted as normal for the operation. When a relevant share of capacity is spent on fixing and working around, the company funds the past with the budget that should build the future.
Resilience and risk
Incidents, time to detect, time to recover, recurring vulnerabilities and dependence on key people turn technical fragility into executive exposure. The discussion stops being system availability and becomes revenue continuity, customer trust and regulatory risk. An incident consumes technical hours, executive attention and room to maneuver.
Decision quality
When different areas arrive at the meeting with different numbers, the company loses time arguing about data instead of deciding. Data without ownership, low traceability and conflicting metrics reduce the quality of forecast, capital allocation and prioritization. Technology immaturity, here, delays decisions, not only systems.
Return on investment
How many initiatives scaled, how many died in pilot, how many delivered the promised benefit. This front is critical in AI, data, automation and modernization. The risk lies in keeping experiments without a scale criterion, without a value owner, without a baseline and without an explicit decision to continue, correct or end, not in experimenting.
The economic test separates real modernization from cosmetic modernization
Cosmetic modernization changes how technology looks. Economic modernization changes the structure of cost, risk, velocity or value capture capacity.
Replacing a platform can be necessary. Moving to cloud can be right. Adopting AI can create advantage. Rewriting a system can unlock scale. None of these decisions is economically mature by definition.
The test is simple and hard. Did the change reduce cycle time, operating cost or incident exposure? Did it raise data reliability or revenue capture? Did it reduce dependence on key people? If the answer cannot be observed, even through partial indicators, the company may be only relocating complexity. And relocated complexity charges interest again. It is the same ruler that separates modernization that moves results from swapping technology.
Technology maturity is an operational asset, not an isolated project
A project has a beginning and an end. Technology maturity needs a baseline, governance, cadence and recurring decision.
That does not mean chasing maximum maturity in everything. Excessive maturity in an irrelevant capability also wastes capital. The target is enough maturity in the capabilities that sustain the strategy. A company that competes on velocity needs maturity in engineering, architecture, platform and observability. A company under regulatory pressure needs maturity in security, data and governance. A company that depends on margin needs maturity in operational efficiency and FinOps.
The right executive question is which capability must evolve so the business executes better, with less risk and more return, not which technology to adopt.
Cutting spend can reduce expense and raise the unit cost of technology
Under margin pressure, cutting spend looks like a rational answer. Often it is. The problem is the linear cut, with no distinction between waste and critical capability.
Cutting an underused license is discipline. Reducing redundancy is management. Removing a tool with no owner is efficiency. Cutting architecture, security, data, automation and engineering without redesigning the operation raises the unit cost of technology. The company spends less this quarter and pays more in the next cycle, with more rework, more risk, more queue and more manual dependency.
The mature agenda asks which cost must disappear because it creates no value and which investment must be protected because it reduces future exposure, not only where to cut.
An executive scorecard changes the conversation
The most pragmatic way to start is to build an economic exposure scorecard for technology immaturity. It crosses the five dimensions. Delivery flow, operational efficiency, resilience and risk, decision quality and scalable ROI. For each dimension, the company defines signals, metrics, owner, baseline, estimated economic impact and recommended decision.
The goal is to create a common language between technology, finance and business, not to produce a perfect spreadsheet. Without that language, each area defends its own reading. With it, leadership prioritizes capabilities, sequences investments and measures progress. The delivery metrics from the DORA program, such as lead time and deployment frequency, anchor the flow front in that scorecard.
An execution path in three moves
The first move is to map the signals. Where the company loses deadlines, margin, energy, trust or velocity because of technology. The focus is operational, not opinion based.
The second move is to convert signals into exposure. A delivery delay represents postponed revenue. An incident represents lost sales, reputational credit and executive hours. Inconsistent data represents poorly allocated capital. A pilot without scale represents investment with no return.
The third move is to prioritize capabilities. Not every pain deserves a project. Some ask for a standard. Others ask for governance, automation, architecture, observability, reliable data or a change in the operating model. This is where technology stops being a cost center and becomes the execution system of the business. Prioritization by economic criteria sets the sequence.
What leadership must decide now
Leadership does not need to wait for the next big transformation to act. It needs to choose three things. First, which costs of immaturity will be measured in the next executive cycle. Second, which capabilities will have a baseline and an owner. Third, which investments will be protected because they reduce structural cost, risk or variability.
That decision looks simple and it is not. It changes the political game of the budget. Instead of funding isolated projects, the company starts funding capabilities that sustain revenue, margin, productivity, governance and customer experience.
Conclusion
Technology immaturity is expensive because it disguises itself as normal. A delay here. A rework there. An incident treated as an exception. A number questioned at closing. A pilot that never scales. A manual dependency everyone knows and no one resolves.
While this bill has no name, it looks inevitable. When it gains a number, an owner and a cadence, it becomes an executive decision. Mature companies do not invest in technology to look modern. They invest to reduce exposure, accelerate execution, protect margin and expand the capacity to compete.
The cost of immaturity already exists. The decision is to keep paying in silence or to turn that bill into a plan of evolution. Which cost of your technology immaturity could you name, measure and prioritize as early as the next cycle?
Sources
- WatchZ. "Costs of technology immaturity in the enterprise". Published on May 26, 2026.
- DORA. "DORA's software delivery performance metrics". Official guide on throughput and delivery instability metrics. https://dora.dev/guides/dora-metrics/
- Gartner. "How to Prioritize and Sell Technical Debt Remediation". Public abstract, 2025.
- Gartner. "Secure CIO Support for Effective Reduction and Prevention of Technical Debt". Public abstract, 2025.
- NIST. "The NIST Cybersecurity Framework (CSF) 2.0". Published in February 2024. https://www.nist.gov/cyberframework
- Behutiye, W. N. et al. "Analyzing the concept of technical debt in the context of agile software development: A systematic literature review". 2024.